LABORATORY OF REMOTE SENSING
|
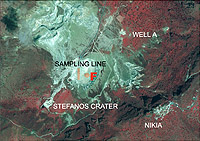
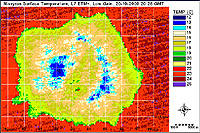
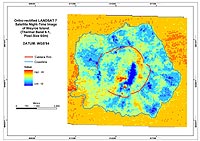
Research > Satellite Thermal Imanging > LANDSAT The effectiveness of the LANDSAT satellite series as a volcano-monitoring tool using digital image processing tools within the GEOWARN Project is demonstrated. The advent of ETM+ (Enhanced Thematic Mapper +) sensor onboard the LANDSAT 7 satellite offers the capability of detecting emitted energy from the Earth's surface at the resolution of 60 metres every 16 days. This capability offers the opportunity to study small volcanos with crater diameters ranging between 100-250 metres, such as those of the Nisyros Volcano. Thermal imaging of Nisyros volcano Six (6) field campaigns were conducted in September 2000, October 2000, November 2001, May 2002, July 2002 and October 2002, respectively. The campaigns aimed at collecting ground truth temperature data, twice a day, to calibrate the surface temperatures computed from the channel 6 of the LANDSAT 7 satellite, as well as band 13 of ASTER sensor, and ground thermal images. The land surface data were collected inside the Stephanos Crater, and at the two geothermal wells nearby (see Figure 1). The field measurements were conducted using digital thermometers with piercing probes. Three scheduled LANDSAT7 ETM+ night-time thermal images were processed for the production of Land Surface Temperature (T) Maps of Nisyros Volcano. The first LANDSAT Fast-L7A (Oct. 20, 2000) imagery was acquired at the Level 1G (Systematic) Product, with radiometric and geometrical corrections, including systematic geometric correction based on spacecraft telemetry and data from the Level 0R input product and calibration. First, the L7A data passed a detailed quality control. Then, the file was subsetted at the area of interest and the atmospheric correction software packeges ATCOR2 and ATCOR3 processed both thermal bands. Note that all the images that had to be processed by the use of ATCOR3 had to be first ortho-rectified using the Geomatica OrthoEngine software of PCI (version 8.2.1). A Digital Elevation Model with a cell size of 2m (Vassilopoulou & Hurni, 2001; Vassilopoulou et al., 2002), as well as a number of selected ground control points (GCPs) relating to the DEM were applied, too.
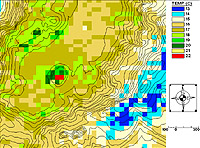
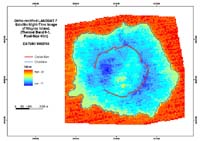
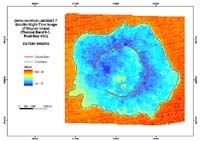
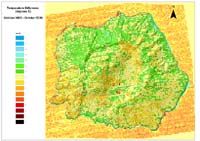
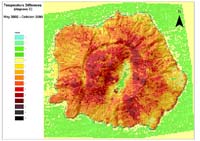
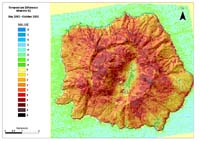
Night thermal data were also collected from the ETM+ sensor on May 19, 2002, as well as Oct. 26, 2002. The images arrived in GeoTiff, as well as in Fast-L7A format, respectively, at a level of 1G (Systematic) product with radiometric and geometrical corrections including systematic geometric correction based on spacecraft telemetry and data from the Level 0R input product and calibration. The low thermal bands of both images were processed using ATCOR3 and Land Surface Temperature (T) Maps of Nisyros Volcano (Images 5, 6) were produced. The ortho-rectified and atmospherically corrected LANDSAT7 ETM+ night-time thermal images of Nisyros (Images 4, 5 & 6) were calculated for the period 2000-2002 to produce the Surface Temperature Difference Maps (STDM). These maps (Images 7, 8, & 9) will give a view of the ground surface temperature variation of Nisyros Volcano during 2000-2002.
|
|
[GPS|DINSAR|TThermal Imaging|Optical
Images|GIS|Digital
Cartography]
[Personnel|Recent publications|Projects|Links] [webmaster@space-unit.gr] |