LABORATORY OF REMOTE SENSING
| Research > Interferometry > Santorini The spatial
deformation
of the Santorini Complex during the "quiet" period 1992-2010 deduced by
joint
interpretation of ERS1&2 and ENVISAT images of ascending and
descending
geometry. This period, Palea Kammeni was getting uplifted (2-3 mm/yr),
characterized by an increasing rate of uplift, whilst the adjacent Nea
Kammeni
was subsided (up to -3 mm/yr) with increasing rates. The above two
islets even
though they are considered as a single volcanic center they exhibit a
different
type of vertical motion. The rest of the study area showed a velocity
field
varying from -1 to +2 mm/yr and sub-millimeter acceleration field
values,
indicating a linear deformation during this period. Combining ascending
and
descending radar data, the vertical and horizontal (E-W) component of
the
velocity field were determined. Several deformation patterns were
identified: The
two main tectonic features, the Columbo and the Kammeni lines at the
northern
and central part of the system, the Alpine basement at the SE part of
Thera,
and a pattern associated with the graben basin at the southern part,
consistent
to earlier AMT work and the recently compiled Gravity Anomaly Map. The
remeasurement periods of the GPS network (established in 1994) resulted
in the
calculation of the strain field, and velocity deformation patterns
consistent
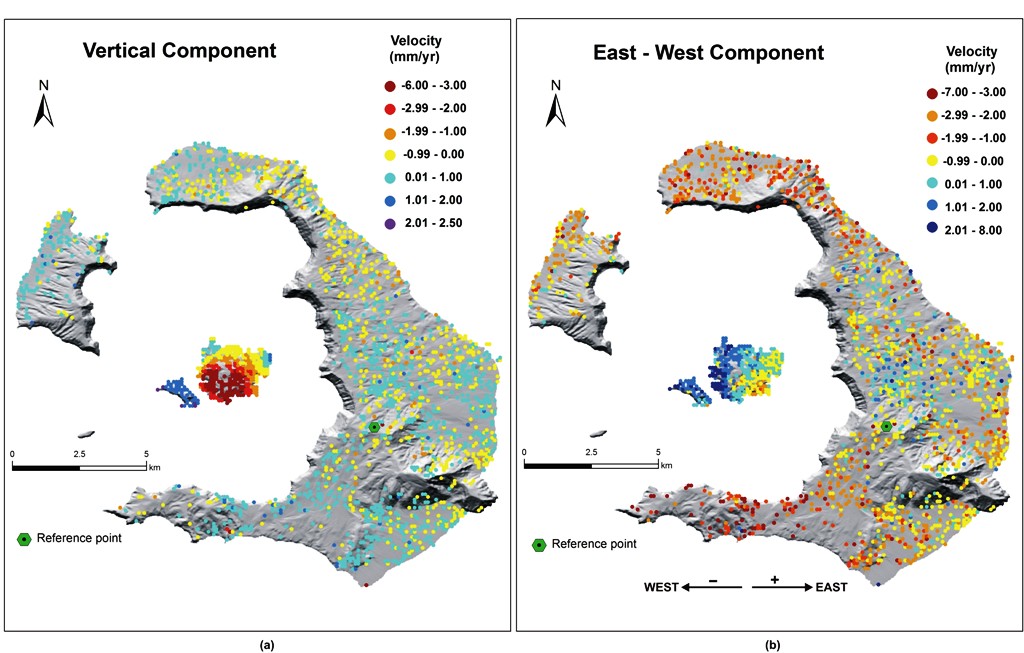
to the SqueeSAR analysis results. SqueeSAR
Results for the period 1992 - 2010 (by T.R.E) Ground
velocity maps of (a) the
Vertical, and (b) Horizontal
(in E-W direction) components deduced by combining Ascending and
Descending data sets (1992-2010).
The deformation
study for the
“active” period
2011-2012 was based on the SqueeSAR analysis of ENVISAT images of
≈39 deg
LOS angle,
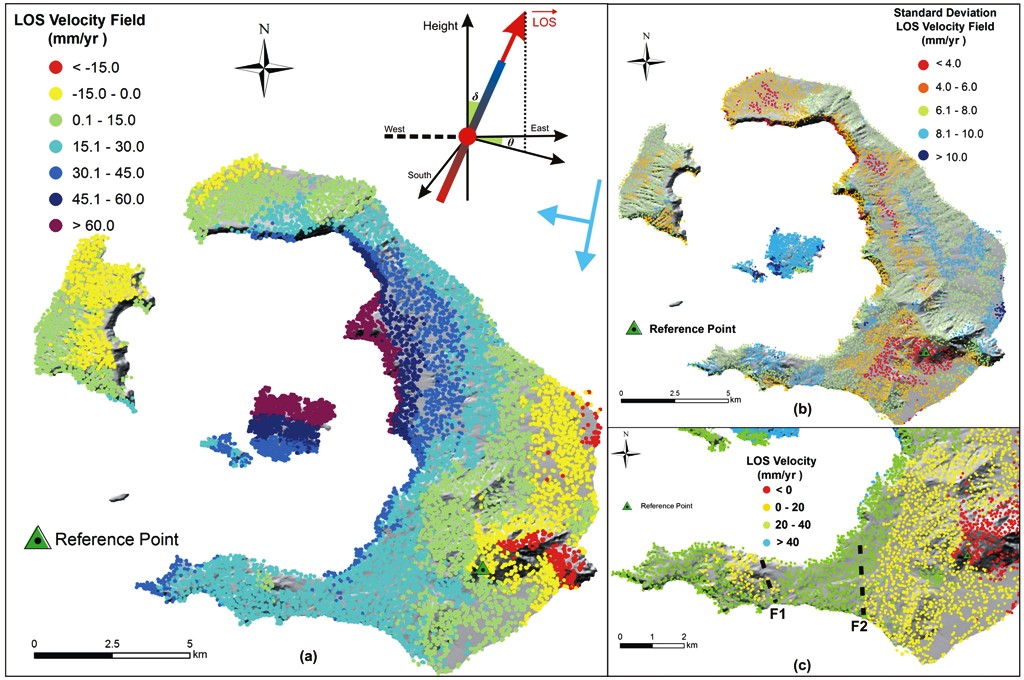 (a) Ground LOS velocity (mm/yr) map for the unrest period April 2011 to March 2012 (δ ≈39ο, θ ≈11ο); (b) Standard Deviation of the LOS velocity field; (c) LOS velocity field focusing at the southern part of Thera (different coloured scale). 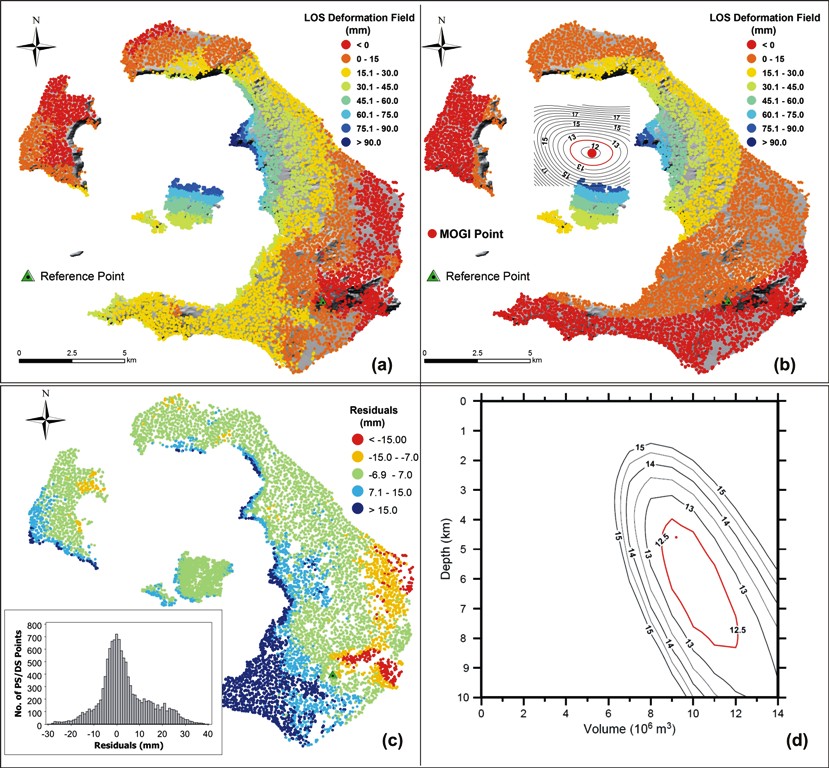 SqueeSAR
Mogi modelling for the period April 2011 to March 2012. (a)
Observed LOS deformation field (mm); (b) Calculated
LOS deformation field showing also the location (red dot)
of the best-fit source,
together with the normalized χ2 error contour lines; (c)
Map of residuals (in mm) between observed and calculated values,
together with their histogram distribution; (d)
Diagram between depth and volume variation for the best fit
location. Red contour lines indicate
the 90% confidence level. REFERENCES:
|
| [GPS|DINSAR|Thermal Imaging|Optical
Images|GIS|Digital
Cartography] [Personnel|Recent publications|Projects|Links] [webmaster@space-unit.gr] |