Research > DiNSAR
>
Nisyros Volcano
Suitable
interferometric pairs of SAR images have been selected (table 1) after searching European's Space Agency
FRINGE according to the following criteria:
- Bp
< 100 m
- Acquisitions
of the same season to avoid seasonal land use changes
- Temporal
separation between the scenes of the same pair covering the periods
1996/1999 and 1999/2000
The
two-pass Differential interferometry method (or DEM-elimination method)
has been applied. This method employs two SAR images, thus producing
one interferogram. To perform the differencial, another interferogram
has to be created or synthesized. The synthesized interferogram is
generated from an existing digital elevation model (DEM). The
synthesized interferogram is then subtracted from the original
interferogram, thereby removing all fringes that relate to ground
elevation, leaving only fringes that represent surface displacements.
The phase differences, which remain as fringes in the differential
interferogram are a result of range changes of any displaced point on
the ground from one interferogram to the next. In the differential
interferogram, each fringe is directly related to the radar wavelength
(5.6 cm for ERS satellites) and represents a displacement relative to
the satellite of only half the above wavelength (28 mm).
Table 1
Technical characteristics of interferometric pairs:
| DATE |
ORBIT |
FRAME |
PASS |
SATELLITE |
BP (m) |
| 22-MAY-1995 |
20135 |
2871 |
DESCENDING |
ERS-1 |
85 |
| 22-JAN-1996 |
23642 |
2871 |
DESCENDING |
ERS-1 |
| ¦
4 months overlapping |
| 04-SEP-1995 |
21638 |
2871 |
DESCENDING |
ERS-1 |
58 |
| 20-AUG-1996 |
6975 |
2871 |
DESCENDING |
ERS-2 |
| ¦
2 months overlapping |
| 11-JUN-1996 |
5973 |
2871 |
DESCENDING |
ERS-2 |
44 |
| 06-JUL-1999 |
22005 |
2871 |
DESCENDING |
ERS-2 |
| ¦
5 months gap |
| 05-DEC-1999 |
24188 |
729 |
ASCENDING |
ERS-2 |
104 |
| 10-SEP-2000 |
28196 |
729 |
ASCENDING |
ERS-2 |
| May 22, 1995 -> January 22, 1996
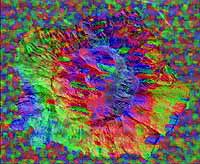
Image 1 (600x493 jpg, 90 Kb)
|
September 04, 1995 -> August 20, 1996
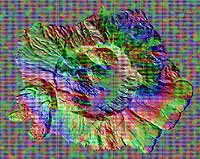
Image 2 (600x476 jpg, 86 Kb)
|
| June 11, 1996 -> July 06, 1999
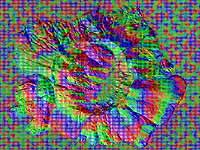
Image 3 (600x451 jpg, 88 Kb)
|
December 05, 1999 -> September 10,
2000
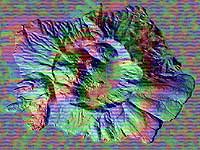
Image 4 (600x451 jpg, 90 Kb)
|
The
differential interferometric SAR processing and analyses were based on
Atlantis software. At first the DEM of the island was created with a
resolution of 4m/pixel by digitizing the contour lines from the
topographic 1:5,000 scale map. As a next step, the initial orbit state
vectors have been taken from the Delft Institute (NL) for
Earth-Oriented Space Research (DEOS) for both pairs. DEOS precise ERS-2
orbits are based on the DGM-E04 gravity field model and the SLR and
OPR2 altimeter crossovers and normal points (Scharroo & Visser
1998). In the coregistration step the master and slave scenes were
validated; a coregistration refinement has also been performed, between
the two scenes for each pair, of bilinear polynomial order, and the
orbit/earth geometric analysis has been calculated. The input master
scene and the external DEM were coregistered by displayed the external
DEM as a simulated SAR image. The finally obtained RMS of the
co-registration was almost half of pixel in the column direction and in
the row direction. After the generation of a first (raw) interferogram,
the flat Earth phase and topographic phase were subtracted. A phase
coherence map has been created and the raw interferogram has been
enhanced. It is deduced from the coherence images that the
south-western and eastern part of the island shows a fairly good
coherence, while the coherence is low to very low at the rest of the
island. The areas showing good coherence image correspond to Nikia
rhyolites, Prophitis Ilias dacites and lavas, while coherence is lost
in the other rock-cover types, like pyroclastics, pumice etc.
Additionally, the typical volcanic landscape of the island forms steep
slopes in the caldera area, where the signal is not depicted by the
satellite sensor (areas under shadow) except for the coherence image
generated by the ascending pair where a significant part of the caldera
show good coherence.
Summary
on crustal deformation is as follows;
- Image
1
The produced interferometric image from the first interferometric pair,
covering the period 22-May-1995 to 22-January-1996, coincided with the
beginning of the seismic unrest period in Nisyros Island. One
interferometric fringe, equivalent to 28 mm of ground deformation along
the slant direction, was recognized and evaluated. Most of the island
is covered by a circular shape fringe, which extended from the NW part,
covers the southern island and dying out (due to poor coherence) on the
NE part of Nisyros. A second fringe located on the SW extremity of the
island can also be recognized. The two fringes presented different
patterns of deformation, without being connected to each other. The
contact area of the two fringes coincided with the presence of a fault
orientated in N-S direction.
- Image
2
The interferogram for the period September 04,1995 to August 20, 1996
had an overlapping period of four months with the previous described
one. This pair covered the commencement of the seismic activity that
started during the summer of 1996. Two fringes (=56 mm of ground
deformation) were recognized covering most of the island. Nevertheless,
the two fringes presented the full range of colors (RGB= 1 fringe) only
on the west and southwest part of the island, while in the southeastern
part only 1 ½ of fringes was evident.
- Image
3
Almost two interferometric fringes on the western and southern part of
Nisyros, were respectively recognized and evaluated for the period
11-June-1996 to 06-July-1999, corresponding to 56 mm of ground
deformation. These two zones coincide with the main tectonic fractures
of the island. At the eastern part only 1 ½ fringe is observed.
A very distinctive aspect appeared in the southern part where the
fringes presented an abrupt interruption and shift of the color
continuation, may due to the presence of the main faulting zone F1 with
direction NNE-SSW that crosses the island.
- Image
4
The picture is different though for the last interferometric pair
05-December-1999 to 10-September-2000. Three interferometric fringes
may be identified, with direction almost linear (NNE-SSW) covering the
whole of the island. From DGPS measurements during that period it can
be stated that the fringes covering the eastern part of the island may
be attributed to uplift that took place that period, while the fringes
at the central and western part may correspond to subsidence.
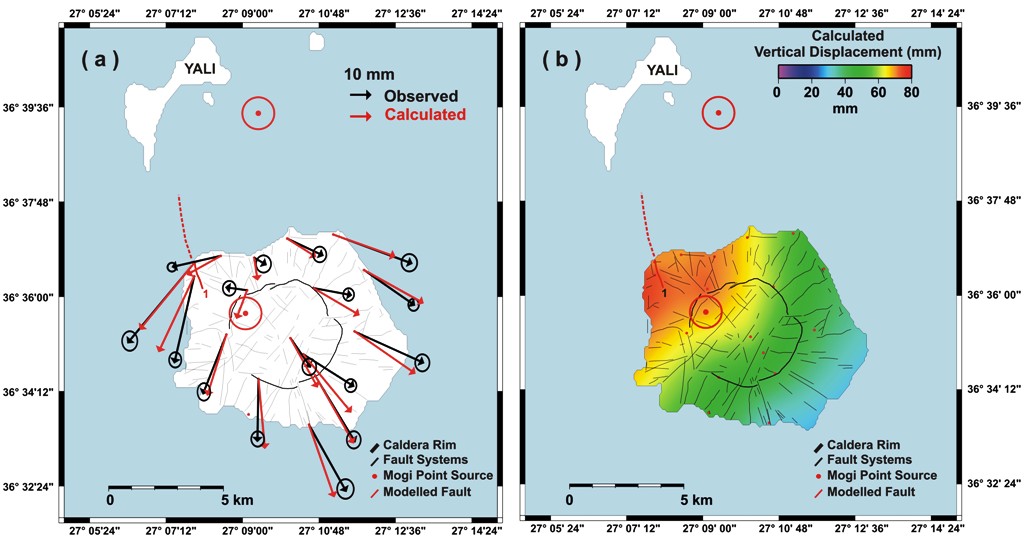
(a) Observed
(black arrows) and calculated (red arrows) horizontal displacements
deduced
from DGPS measurements for period 1997-2001. Calculated (red) arrows
result
from the combination of two Mogi sources (in-land and off-shore) and
fault (red
line) forward modelling. (b)
Same as (a) but for vertical displacements.
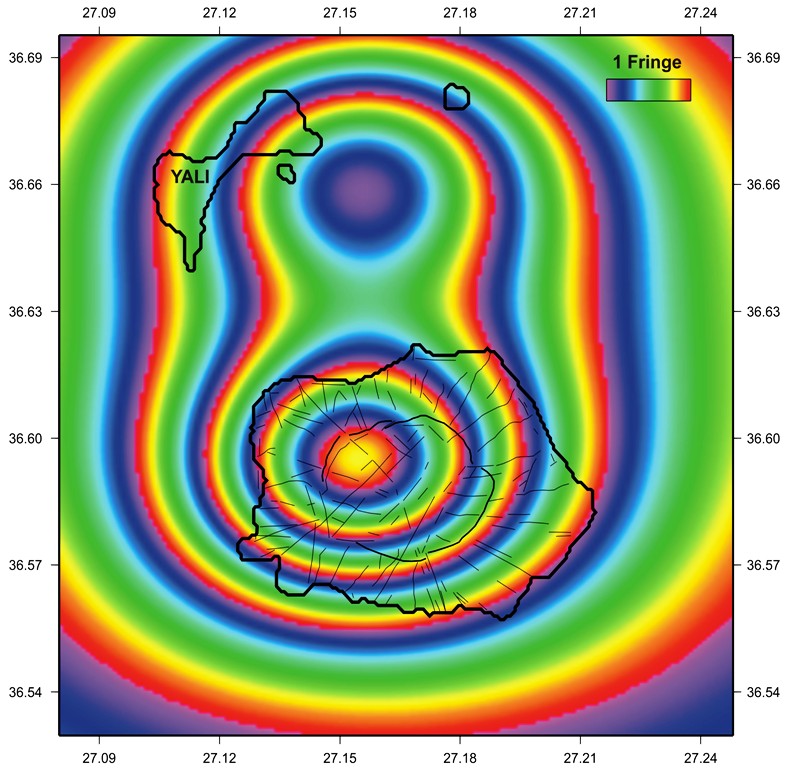
Synthetic
interferometric image of the Nisyros-Yali area deduced from two Mogi
point sources: One located below Nisyros and the other off-shore north
of Nisyros.
REFERENCES:
GEOWARN Project (www.geowarn.org)
Lagios E, Sakkas
V., Parcharidis Is. & Dietrich V. (2005). Ground Deformation of
Nisyros Volcano (Greece) for the period 1995-2002: Results from DInSAR
and DGPS observations.Bull. Volcanology, 68,
201-214.
Surface
displacement model of Nisyros Volcanic Field deduced from DInSAR
analysis & DGPS measurements.
Lagios E., Sakkas V., Parcharidis Is. & Vassilopoulou Sp.
Proc. 11th General Assembly of Wegener Project, Sept. 2002, Athens,
Greece.
Will
Nisyros Volcano (GR) Become Active? Seismic Unrest and Crustal
Deformation.
Lagios, E., Dietrich, V., Stavrakakis, G., Parcharides, I., Sakkas V.
& Vassilopoulou S.
European Geologist 2001, Vol. 12, 44-50.
|